
Benchmarks
Open Performance, pick one or more requests, choose a load profile and press Start. The results stream in while the run is going.
Load profiles
| Profile | What it does |
|---|---|
| Fixed | A number of parallel senders share a total number of requests. |
| Ramp | The number of senders grows from a start value to an end value over a duration. |
| Rate | Aims for a number of requests per second, however long each one takes. |
| Watch | Samples on an interval to find outages. See Watching for an outage. |
Reading the results
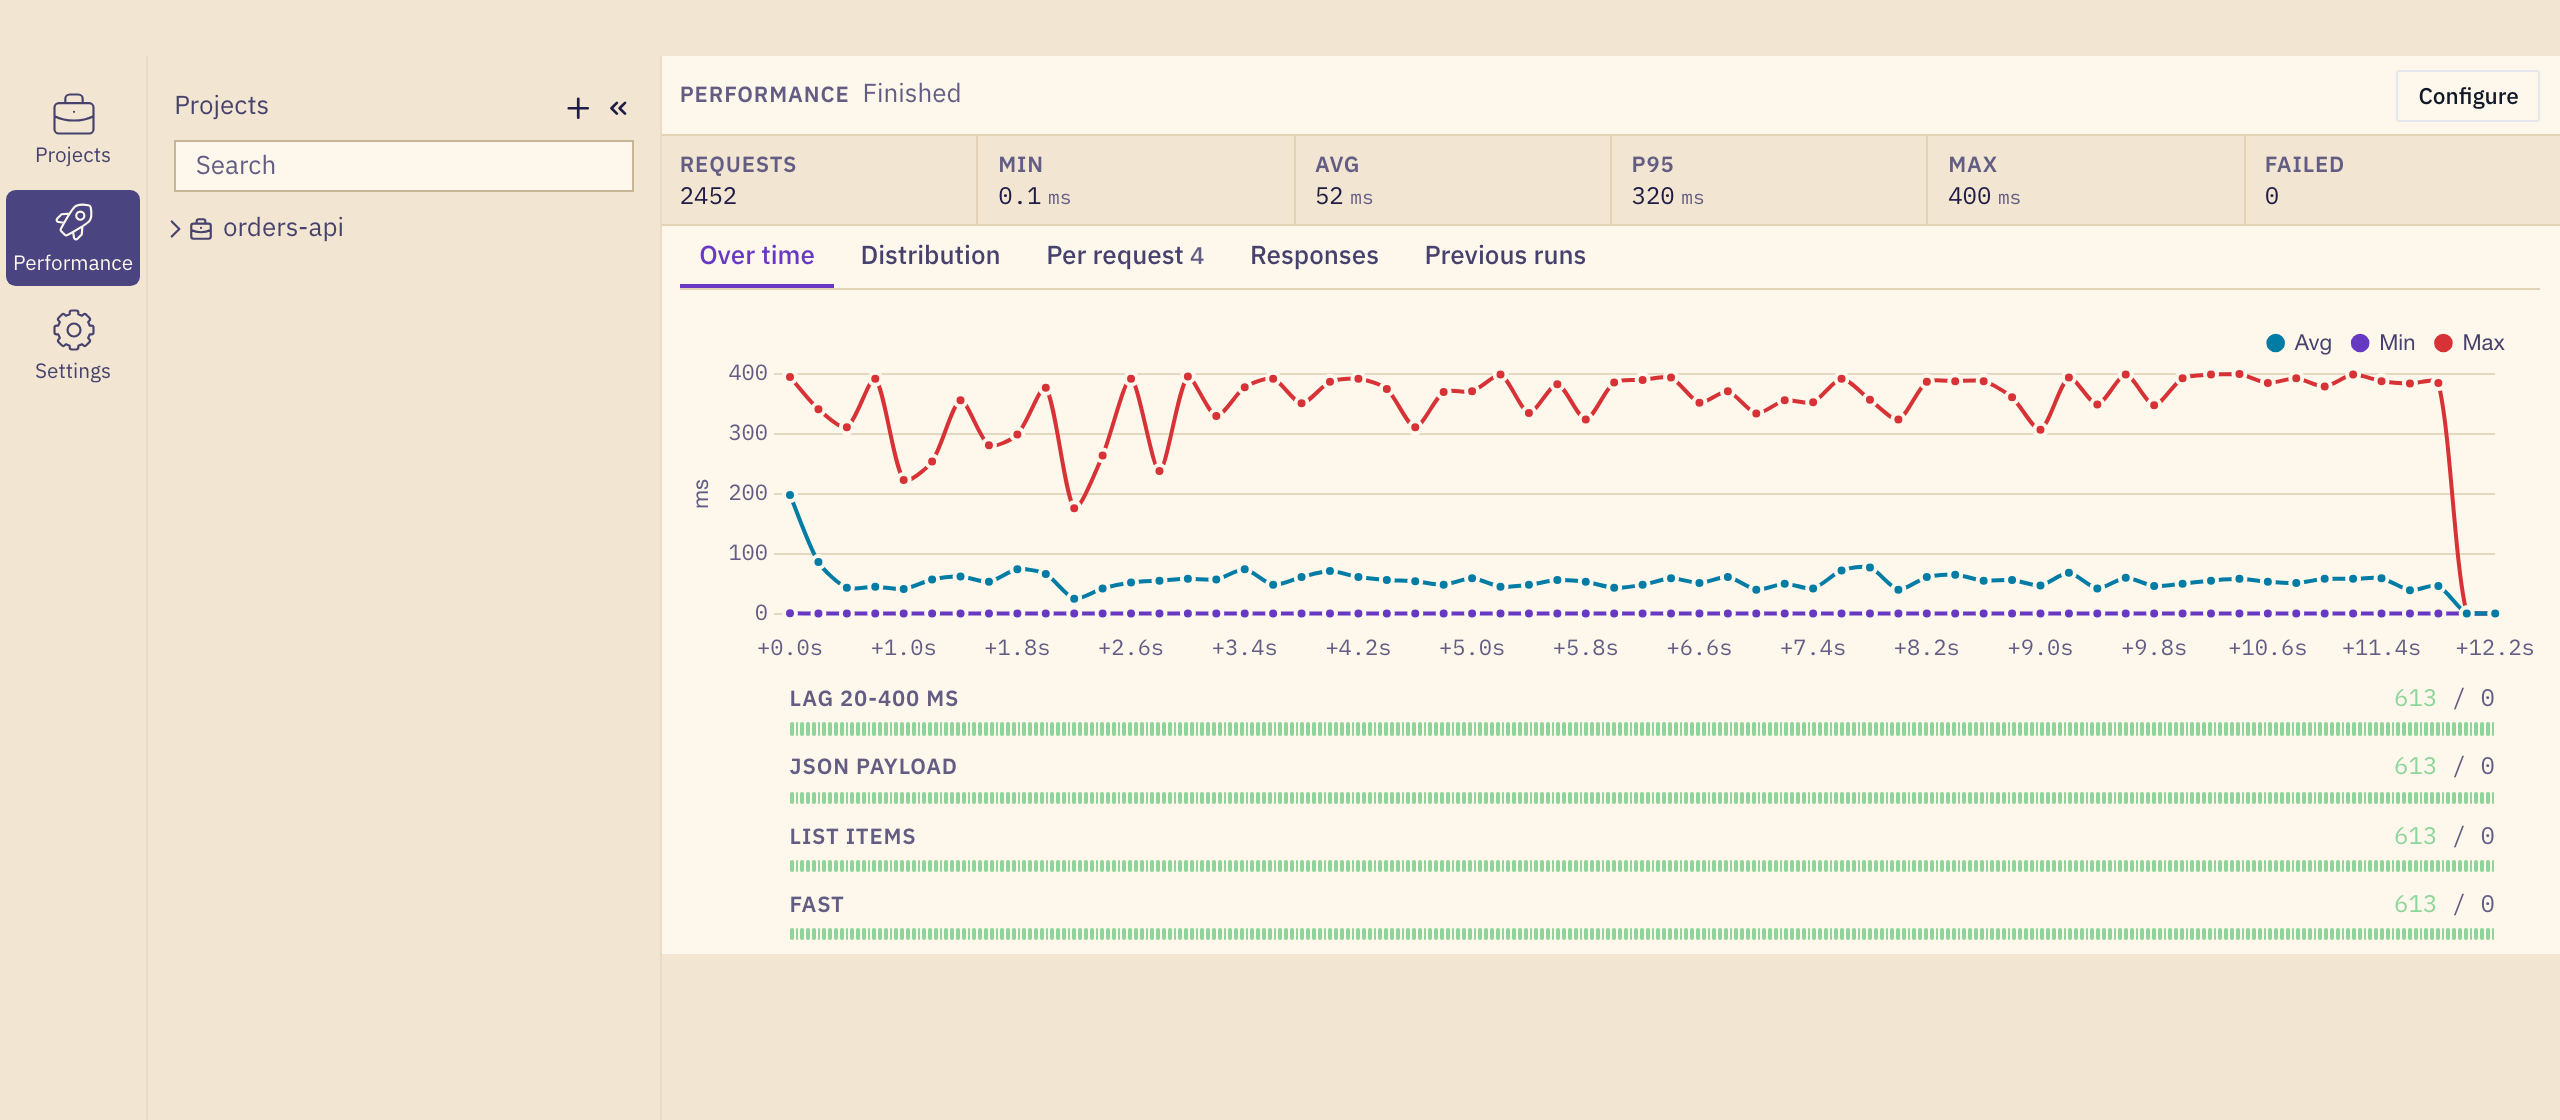
- Tiles: requests, min, average, p95, max and failed.
- Over time: average, min and max per time slice, with an outcome strip for each request.
- Distribution: how the durations spread.
- Per request: the same numbers for each request on its own.
- Previous runs: earlier runs of the same benchmark, to compare.
Durations below 2 ms are kept to a tenth of a millisecond, so a fast local API still has a distribution. The aggregation keeps no per-response list, so a run of a million responses costs the same to display as a run of a thousand.
What is sent
A benchmark builds every request exactly as Send does, with the same variables, auth and checks. A failed check counts as a failed request.